Looker Studio - A Better Way to Visualise Data
Looker Studio reports are a great way to visualise your data with powerful interactive dashboards that can be customised to your business.
With Looker Studio you can construct and share in-depth reports on any area of your online performance thanks to a great variety of data 'connectors'. These are simple in-built and third-party apps that allow you to pull data in from external sources, for example social networks, YouTube analytics, Adobe Analytics and other non-Google advertising platforms.
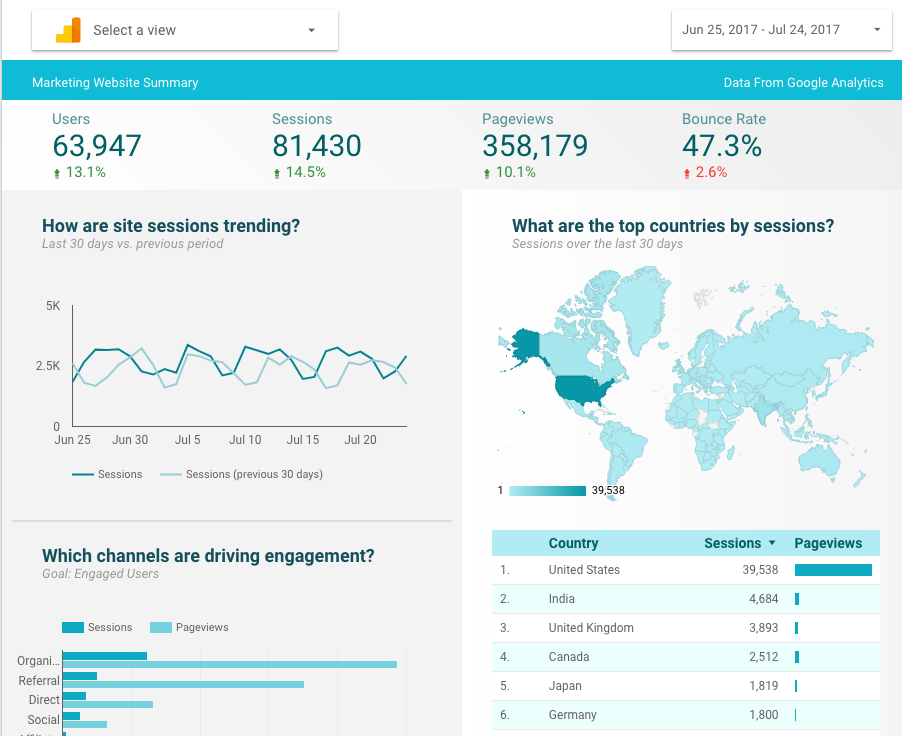
This data can be displayed as interactive charts and tables in a customisable format that can be easily styled to your business with different colours, fonts, and background images if desired.
A mix of filters and segments can be added to any report, on individual graphs within any page. Want to have a comprehensive marketing report, each page delivering a set of bespoke KPIs and revenue details from different sources? No problem, this is the kind of thing Looker Studio was made for.
Data can also be blended from multiple sources (up to 5 in total) that share common dimensions to reveal interesting relationships.
A report can be set up to include filters, allowing you to choose a date range and marketing channel, which adjusts the data you see on the fly.
Then there's the power of collaboration - anyone with a Google account can be invited to view and edit reports, which can then be shared and exported to numerous formats.
Looker Studio mixes the power of Analytics with the convenience of dashboards. Like Google Analytics, Looker Studio is free to use and is a powerful way to visualise the data you need. We've been leaning more and more towards using Looker Studio for our clients and now offer it as a separate service in addition to Analytics dashboards, which still offer a great mix of functionality and convenience.
